
Now that SAM’s predictions for Premier League matches are on the BBC website every week, I am getting asked three questions a lot:
- What is SAM?
- How does SAM work?
- Is SAM any good?
In this blog I hope to give pretty simple answers to these questions, and point the interested reader in the right direction to get more information.
What is SAM (Sports Analytics Machine) ?
SAM is an acronym for Sports Analytics Machine. It is the name we have given to a whole load of data, algorithms, equations and statistical models. This set of “tools” have been developed over the last ten years. At its core, the engine of SAM is a forecasting model for football. From this forecasting model we can do all sorts of nice things like: predict the results and scores of matches (these appear on the BBC match preview webpages for every Premier League match), simulate the final league table and ask what impact a new player might have on a team.
The sports analytics machine reckons Pogba and Ibra are worth an extra 10 points to United this season. https://t.co/35QG36c4r2
— uMAXit Football (@uMAXitFootball) August 11, 2016
For example, we can ask what might Ibrahimovic and Pogba bring to Manchester United).
How does SAM work?
If the engine of SAM is a forecasting model, the fuel is data. SAM uses three types of data:
- Results data on the outcomes of football matches around the world, for many years.
- Event data on the in-game events like the timings, locations and identities of involved players for passes, shots, goals, tackles.
- Scouting data giving ability ratings of players.
Using this data we use statistical models to rate the players across Europe and beyond. We then use the player ratings and the starting 11 for a team to estimate how many goals that group of 11 players can expect to score and concede when they play a math against another group of 11 players. As you might expect, teams made up of highly rated players tend to score at a higher rate, whilst they concede at a lower rate of goals per match, and conversely for teams made up of lesser rated players – they score at a lower rate of goals per match and concede at a higher rate.
How good is SAM?
It is all well and good using clever statistical models to make forecasts. But in the real world, we need to know if the models are any good. Measuring how good a statistical model is at forecasting is a huge area of research in itself. However, it is made a little simpler for SAM. Since we are forecasting the outcome of sporting events we can test SAM against the betting market. This is commonly done in the sports forecasting literature, and the betting market is regarded as the toughest test of a prediction model. Indeed, economists have a very important and famous hypothesis dedicated to the issue of efficiency in such markets. Put simply, the Efficient Markets Hypothesis says that it is not possible to accrue “superior” returns systematically. So a model that can match, or even beat, the bookies is doing very well indeed.
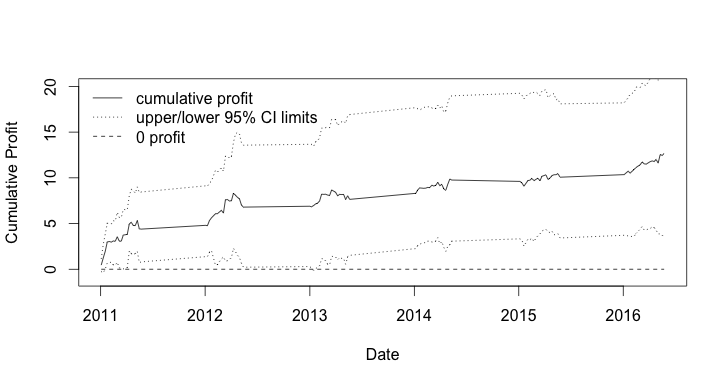 The plot shows the returns to a betting strategy using a simpler version of the model described above. This simpler version is described in this working paper “A Bivariate Weibull Count Model for Forecasting Association Football Scores“.
The plot isn’t an error – over the past five seasons, the simpler version of SAM’s full model is running at a cumulative profit of over 10%. Such returns exceed our expectations and more profoundly, violate the efficient markets hypothesis. But this isn’t new – we know such violations exist. As well as other academic papers presenting models achieving superior returns, there are several large professional betting companies making very good money out of forecasting football match results. But here at least, our interest is not in betting – I wanted to show you what SAM was, and how good it is.
Professor Ian McHale teaches Sports Analytics on the MBA Sports Business.