Search & Social Media Marketing Training
Digital marketing course from the University of Salford
It appears that according to Google, Social Media and small businesses is a combination that does not lead to ecommerce purchases in travel related business, and they are not even useful for promoting brand awareness!
The web page that seems to suggest this is called “The Customer Journey to Online Purchase”. This page allows you to select a country, an industry and a business size it then displays a diagram which places icons representing various channels along a line leading to purchase online.
If you select “Travel”, “UK” and “Small” you get the following diagram;
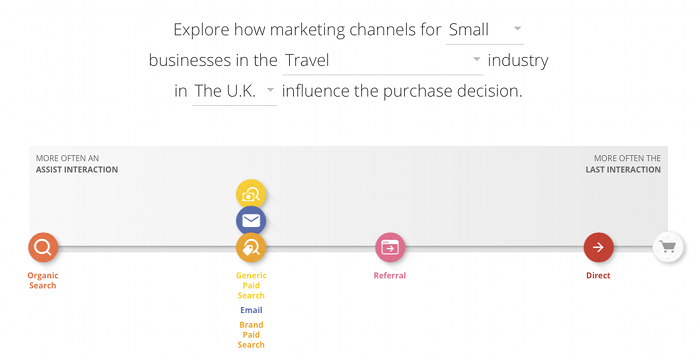
The Customer Journey to Online Purchase
It appears that the nearer an icon is to the right hand side then the more likely an interaction will result in a purchase, and entries nearer the left are good for getting your brand known about.
There are two icons not displayed on this diagram one is Display Click Advertising and the other is Social Media Advertising. On first view it looks like it just isn’t worth buying Display advertising or using Social Media to promote your small travel business. It also suggests that the online interaction that is more likely to assist in the online purchase is Organic Search (left hand side of the diagram) and referrals are the most likely source of last interaction that leads to an online purchase.
Why do I care about this?
This is of interest to me because I am currently working on marketing a guest house in Devon “Rockvale” (definitely small, and travel related and in the UK). Rockvale are already doing lots of the stuff you can do on a website, we have managed to acquire a few links from various places and we have tried pay per click advertising (that is another story).
The obvious next step is to look at social media. But, according to Google this is pointless?
Can it be true?
There were a few attributes about the page in question that concerned me, in particular, though Social Media is very different to the other marketing communication channels mentioned. I could imagine there were reasons for it not being there.
However, display click advertising is not significantly different and I would expect it to be present. After all if I could get targeted banner adverts on, say, websites relating to holiday activities in Devon that surely must be as effective as anything as lots of potential holiday makers must peruse such sites before booking.
What does it mean?
The Online Customer Journey
To make any sense of this we need to know what our customer journey is, in this case a journey appears to start when a potential purchaser clicks on a site because they are interested in going on holiday. This journey contains all the clicks that they make in trying to get to a final decision and finishes when they make a booking.
The diagrams
The main diagram shows channels spread across a page along a line, clearly this line does not represent the Journey, as it would imply people who use Organic searches then use other channels in some sort of strange but defined order.
More likely it means that Organic search result are unlikely to book and people referred are far more likely to book, which makes sense since:
People using a search engine are in their “research mode” and those who found a link on another site are more likely to be already informed.
However for a potential customer, whether they click on an organic search result or a paid for search result it must make no difference. Such a customer may be more likely to click on a paid for entry than an organic entry because it is more prominent, but once clicked they are in the same state, that is, they have:-
- Found a link, either by searching or other means.
- Clicked on that link.
- Arrived at a web site.
Most of the customers of Rockvale that I have talked to have no idea what website they searched from or what web terms they used so the idea that they would react differently when they have clicked on an Organic search rather than a Pay Per Click one is almost ludicrous.
However, paid for searches are usually more prominent than organic searches, so possibly, what this means is “how effective are the different channels at getting a booking”, this makes some sort of sense. But, if this is what it means why is social media not displayed, if not effective it should be at the far left?
Pie charts
Further down the page there is a pie chart for each of the ‘channels’ showing a percentage at beginning middle and end of the Journey.
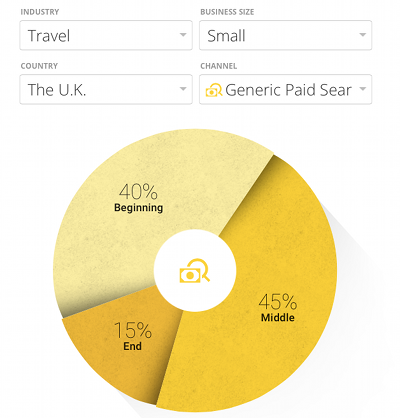
The caption says:-
“Your {channel} campaign may have a different impact on your customers depending on when they interact with it. At the beginning of the purchase path, {channel} helps customers gain awareness of your product or service. In the middle, it creates desire and boosts interest. And at the end, it helps to seal the deal.”
It also states that beginning is the First 25% of the Journey, Mid is the middle 50% and End is the 25% before the booking.
Looking at the “Generic paid for search” pie chart shown above, we get 15% end, 45% middle and 40% beginning.
This appears to mean that of all “Generic paid for search” clicks;
- 15% of clicks on any site are considered to be in the last 25% of the journey.
- 45% in the middle 50% of the journey
- 40% in the last 25% of the journey
Does this mean anything? First thing to note is that all channels except “direct” exhibit extremely similar percentages.
| CHANNEL | BEGIN | MID | FINISH |
| direct | 17% | 45% | 37% |
| referral | 37% | 34% | 19% |
| brand | 36% | 46% | 18% |
| 41% | 50% | 10% | |
| generic | 40% | 45% | 15% |
| organic | 39% | 44% | 16% |
So if we ignore “direct” for a second we see the numbers that are so similar they must be to all intents and purposes be the same.
So irrespective of the channel; potential customers do a lot of clicking at the start, a little in the middle and less at the end.
This is supported by looking at the other industries, which I’m not going to list here, and seeing almost all exhibit similar percentages, even including the direct channel being different to the rest.
I am happy with this understanding, at first they are just scanning through sites looking for some good ideas probably scanning pictures and headlines, at the end before they book (or purchase) they are looking more carefully, perhaps reading rather than looking at headlines, perhaps in the middle they look carefully at some and scan others.
But why is direct so different a mirror image almost. It could be that either they have a recommendation from outside the web or they already know the site, there may actually be no journey to make, perhaps Google are just confused because they cannot understand a journey of one click.
I do not see this pie data as at all useful, it tries to say different things about different channels, but as well as not being in any way clear about what it is trying to say it actually says they are all the same.
The main diagram
The data for the main diagram (small travel businesses in UK) is:-
| CHANNEL | |
| direct | 0.8 |
| referral | 1.71 |
| brand | 2 |
| 2 | |
| generic | 2 |
| organic | 2.9 |
This does not quite fit in with the pie chart data. However a little looking into the details shows that the numbers used are internally called “assistToLast”, which are not described on this page but are on another Google page.
The page “Customer journey to purchase” shows what seems to be the same data, it is not directly comparable as it does not allow the diagram to be varied with company size, it does however contain a description of the data.
A channel’s position on the chart is defined by the “assist/last interaction ratio.”
That page describes the “assist/last interaction ratio” in a rather convoluted way, however it is the ratio;
| “number of sites or clicks during a journey that are not the last before purchase” |
| “The number that are” |
This I think is probably something very like;
| “Number of sites references-The number of purchases” |
| “The number of purchases” |
So Zero would mean just went to a site and purchased, Ten would mean, looked at 10 sites then purchased on the 11th.
If this interpretation is correct
| CHANNEL | ||
| direct | 0.8 | For every 10 bookings made 8 other sites are examined. |
| referral | 1.71 | For every 10 bookings made 17 other sites are examined. |
| brand | 2 | For every 10 bookings made 20 other sites are examined. |
| 2 | For every 10 bookings made 20 other sites are examined. | |
| generic | 2 | For every 10 bookings made 20 other sites are examined. |
| organic | 2.9 | For every 10 bookings made 29 other sites are examined. |
This can be interpreted in all sorts of ways and therefore is pretty useless.
Does this page say anything useful at all?
I think it is now fairly obvious that the reason Social Media is not present, it is that they just don’t have enough data to have any (or perhaps less than they consider reasonable) purchases triggered by social media, so its ratio is always very large, which is not easily graphed, this sort of satisfies my original query.
This diagram has nothing to say about Social Media and small companies, except that they have no data indicating a purchase from these channels, but as we have no information on volume of the other data we have no way of knowing if this is significant, this is not really helpful.
The only other thing this page states is that when a customer is looking for somewhere to holiday they will probably click on lots of hotels, then pick a few and look at them in more detail.
So is this page and it’s diagrams useful to me? In short NO.
So I as yet have no evidence that Social Media is a bad choice for small travel businesses in the UK, I do have evidence that Google tracked transactions see few or no direct bookings, but I don’t know that this is relevant. So as Google won’t (probably can’t) tell me I need to do the experiment myself. “Rockvale” will be getting a blog and accounts on Twitter and Facebook and other places, and we will see where we go from there.
If you want one, the moral of this story is the simpler and more graphical an information display, the more meaningless, but I suppose everyone already knows that.
Tags: Social media and small businesses in the UK, The Online Customer Journey
Posted in analytics, search engine marketing, social media